7 Supermetrics Reporting Templates (AdWords, Analytics, Facebook and more)
Supermetrics is a great tool for automating your marketing reporting.
In this article we will show you seven ways to setup useful marketing reports. These include AdWords performance, AdWords search queries, AdWords placements, Google Analytics traffic and conversions, Google Analytics SEO (search console), Facebook ads and Facebook page performance.
For most of these reports you will need at least the pro version of Supermetrics (free trial here).
If you are unfamiliar with Supermetrics, check out our Supermetrics review.
How To Setup AdWords Reporting Using Supermetrics
One of the most common ways to use Supermetrics for Google sheets is to create automated reporting solutions for your AdWords campaigns or AdWords clients.
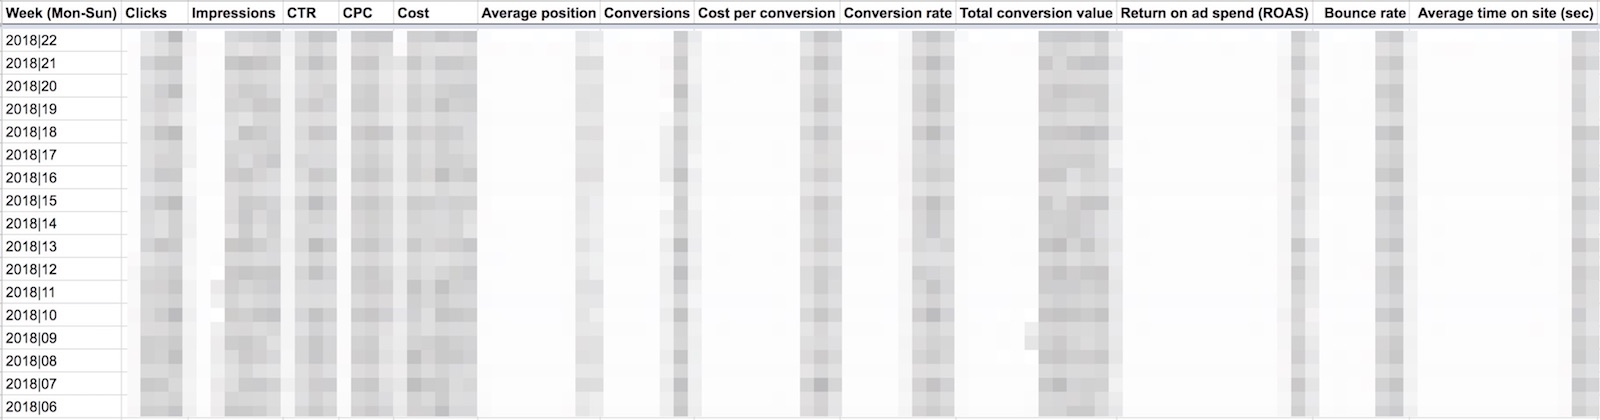
The image above shows a basic reporting including the following weekly metrics: clicks, impressions, click-through rate (CTR), cost per click (CPC), cost, average ad position, conversions, cost per conversion, conversion rate, total conversion value, return on ad spend (ROAS), bounce rate and average time on site.
Here are the Supermetrics settings to replicate this type of report:
- Data source: Google AdWords
- Select accounts: select the account you what to create a report for
- Select dates: I like to use “last X years” and select 3 years. Also, tick the box “including this year”
- Select metrics: Clicks, Impressions, CTR, CPC, Cost, Average Position, Conversions, Cost per Conversion, Conversion rate %, Conversion Value, Return on ad spend (ROAS), Bounce rate %, Average time on site (sec)
- Split to rows: Year & week (Mon-Sun)
- Sort rows: Year & week (Mon-Sun
- Sort direction: Descending
- Secondary sort: Automatic
This type of report would provide an overview of the performance of all AdWords campaigns in your selected account.
If you would like to report on only one campaign, use the following filter settings:
- Filter: Campaign name + contains + “your chosen campaign”
If you would like to report on multiple campaigns, use the following settings:
- Filter: Campaign name + contains + “your chosen campaign”
- AND
- Filter: Campaign name + contains + “your chosen campaign”
AdWords Search Query Reports Using Supermetrics
One of the most time-consuming yet important ways to optimize your AdWords campaigns is to analyze search query reports and add negative keywords. Here we will show you an easy way to setup an automated search query report that automatically filters low-performing search queries for you.
Here are the Supermetrics settings to replicate the search query report:
- Data source: Google AdWords
- Select accounts: select the account you what to create a report for
- Select dates: last X days and type in 30 days (or longer)
- Select metrics: Clicks, Impressions, CTR, Average Position, Cost, Conversions, Cost per Conversion, Conversion rate %, Conversion Value
- Split to rows: Matched search term
- Sort rows: Cost
- Sort direction: Descending
- Secondary sort: Automatic
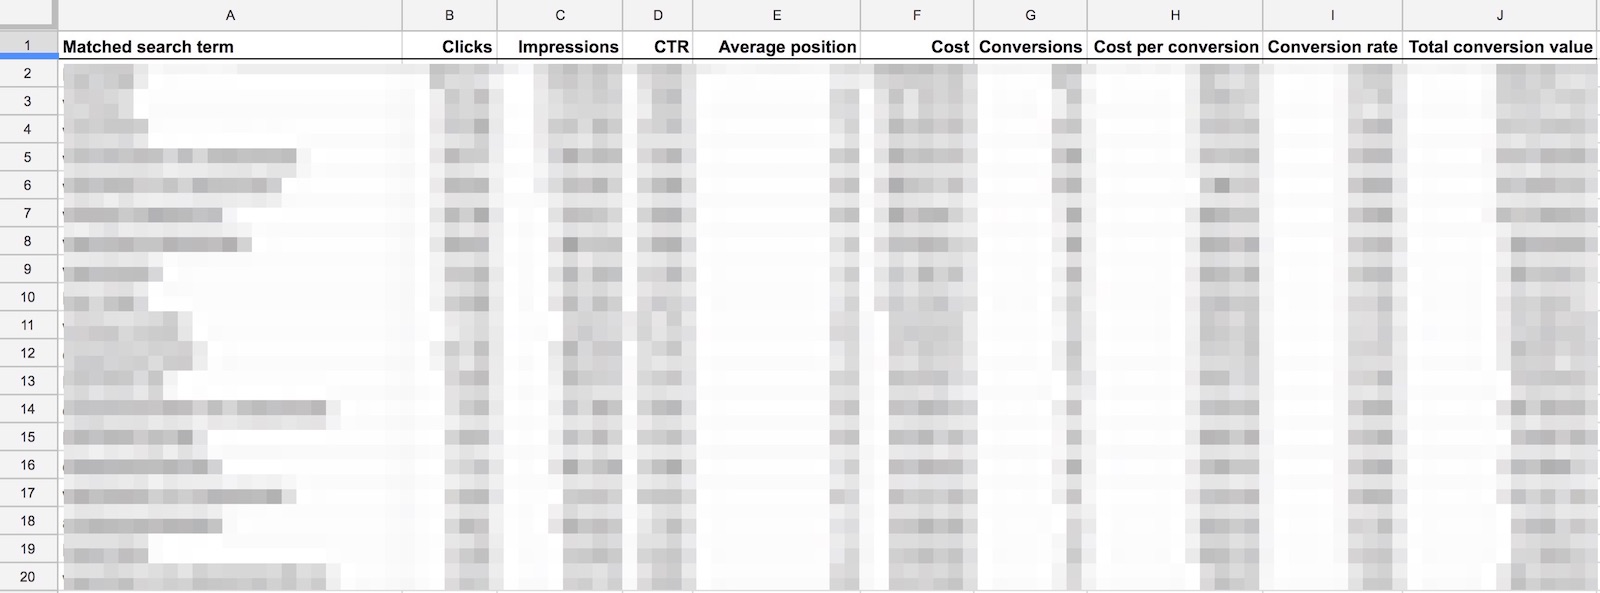
This report will show all search queries from your AdWords account within the specified duration.
In order to filter out the low performing search terms, you need to create a filter in Google Doc.
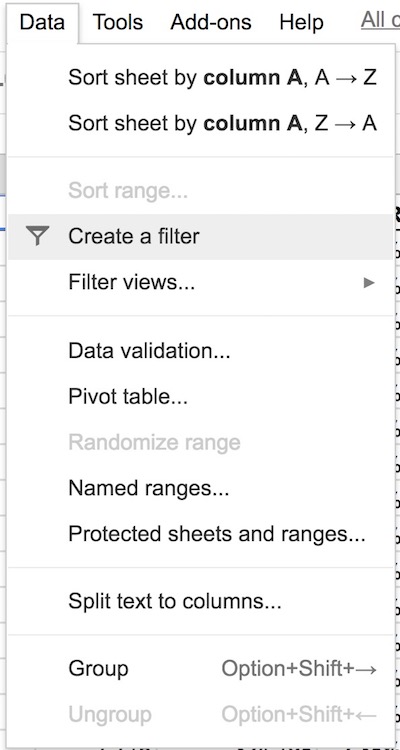
- In the Google Docs menu, click “Data” -> “Create a filter”
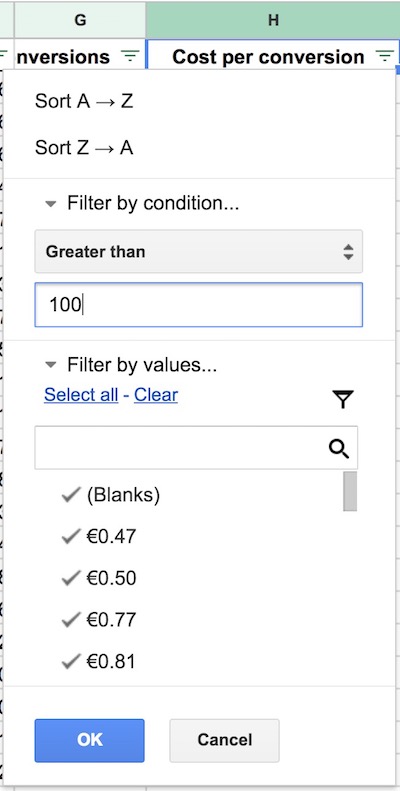
- Then click the filter icon in the “Cost per conversion” column.
- Click “Filter by condition”, select “Greater than” and type in the value you want to filter for
- In the example below we are filtering search terms that generated a cost per conversion of more than €100.
Now you are all set.
AdWords Placement Report using Supermetrics
Optimizing display campaigns can be very tedious. The following Supermetrics report will make this task much faster and easier.
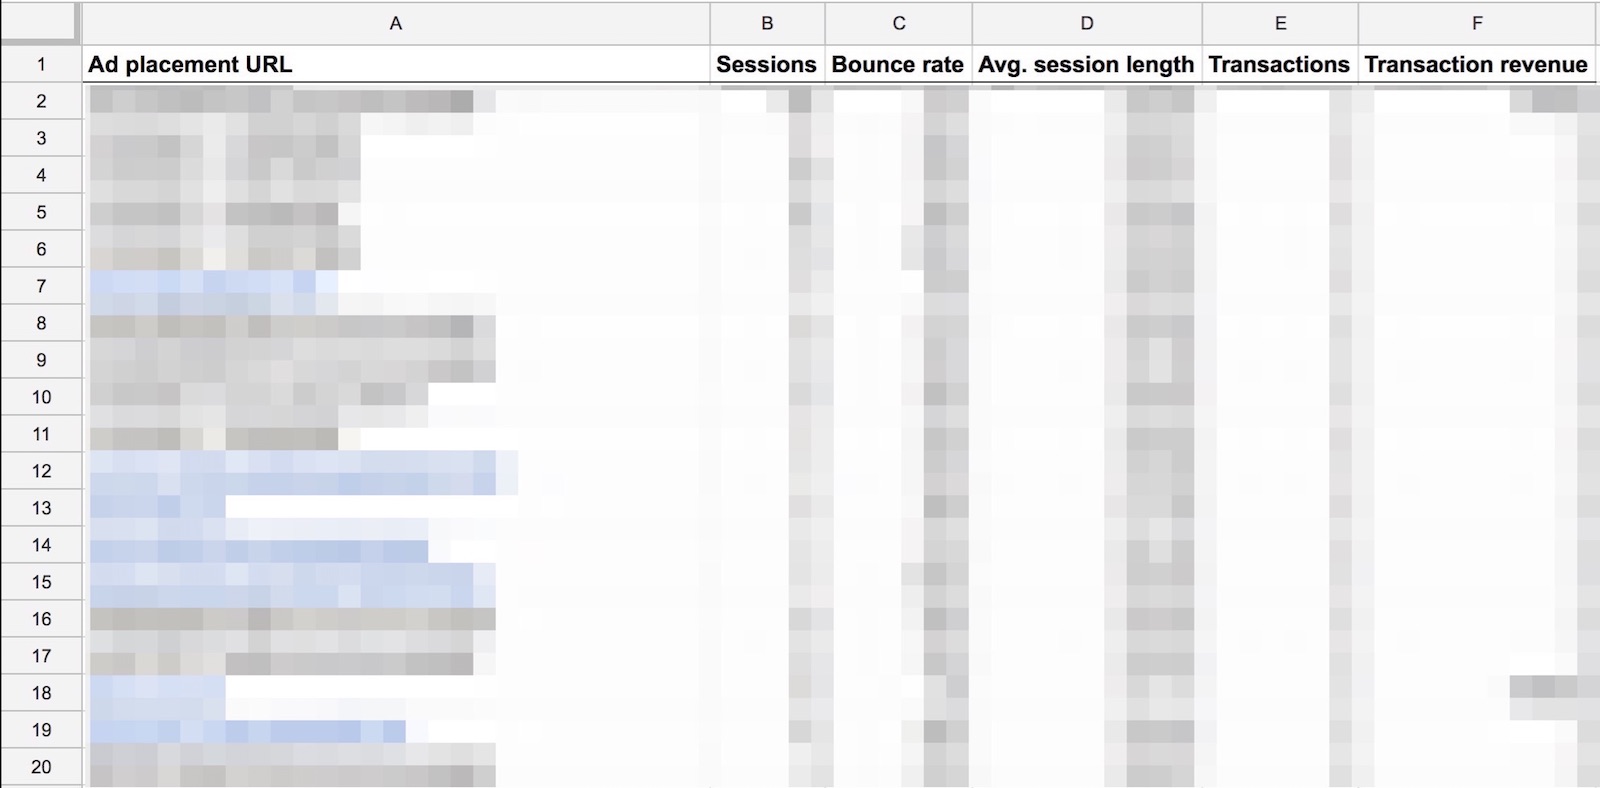
The image above shows a Supermetrics placement report. Since we are pulling the data from Google Analytics we can show placement data along with bounce rate and avg. session length.
Bounce rate and sessions length are not available in AdWords placements reports. By cutting out placements with a high bounce rate or very low session length you can cut down your optimization time significantly.
Here are the Supermetrics settings to replicate the placement report:
- Data source: Google Analytics
- Select accounts: select the account you what to create a report for
- Select dates: last X days and type in 30 days (or longer)
- Select metrics: Sessions, Bounce rate, Avg. sessions length (h:m:s), Transactions, Transaction revenue.
- If you are not using eCommerce tracking you can use goals instead of transactions above
- Split to rows: Ad placement URL
- Sort rows: Sessions
- Sort direction: Descending
- Secondary sort: Automatic
Once you have setup your placement report, you can use a Google sheets filter (as shown above) to only show the placements with the highest bounce rate or lowest session length.
Google Analytics Traffic and Conversion Report using Supermetrics
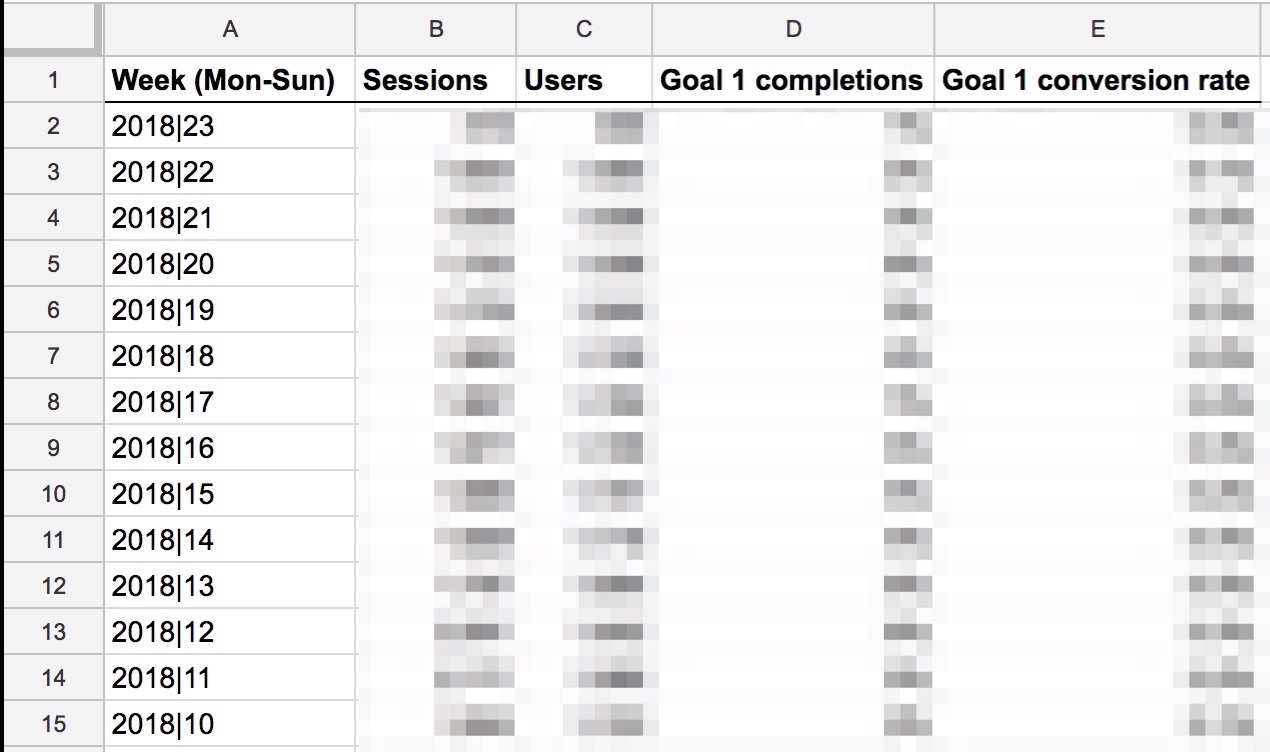
Supermetrics also makes it easy to generate weekly or monthly traffic and conversion reports for you. The report above shows sessions, users and goal conversions from Google Analytics on a weekly basis.
Here are the Supermetrics settings to replicate the traffic and conversion report:
- Data source: Google Analytics
- Select accounts: select the account you what to create a report for
- Select dates: last X weeks and type in 52 weeks (or longer)
- Select metrics: Sessions, Users, Goal X completions, Goal X conversion rate (pick the goal you want to show in your report)
- Instead of showing goals you can also show eCommerce transactions and transaction revenue
- Split to rows: “Year & week (Mon-Sun)” or “Year & month”
- Sort rows: Year & week (Mon-Sun)
- Sort direction: Descending
- Secondary sort: Automatic
Google Search Console Report using Supermetrics
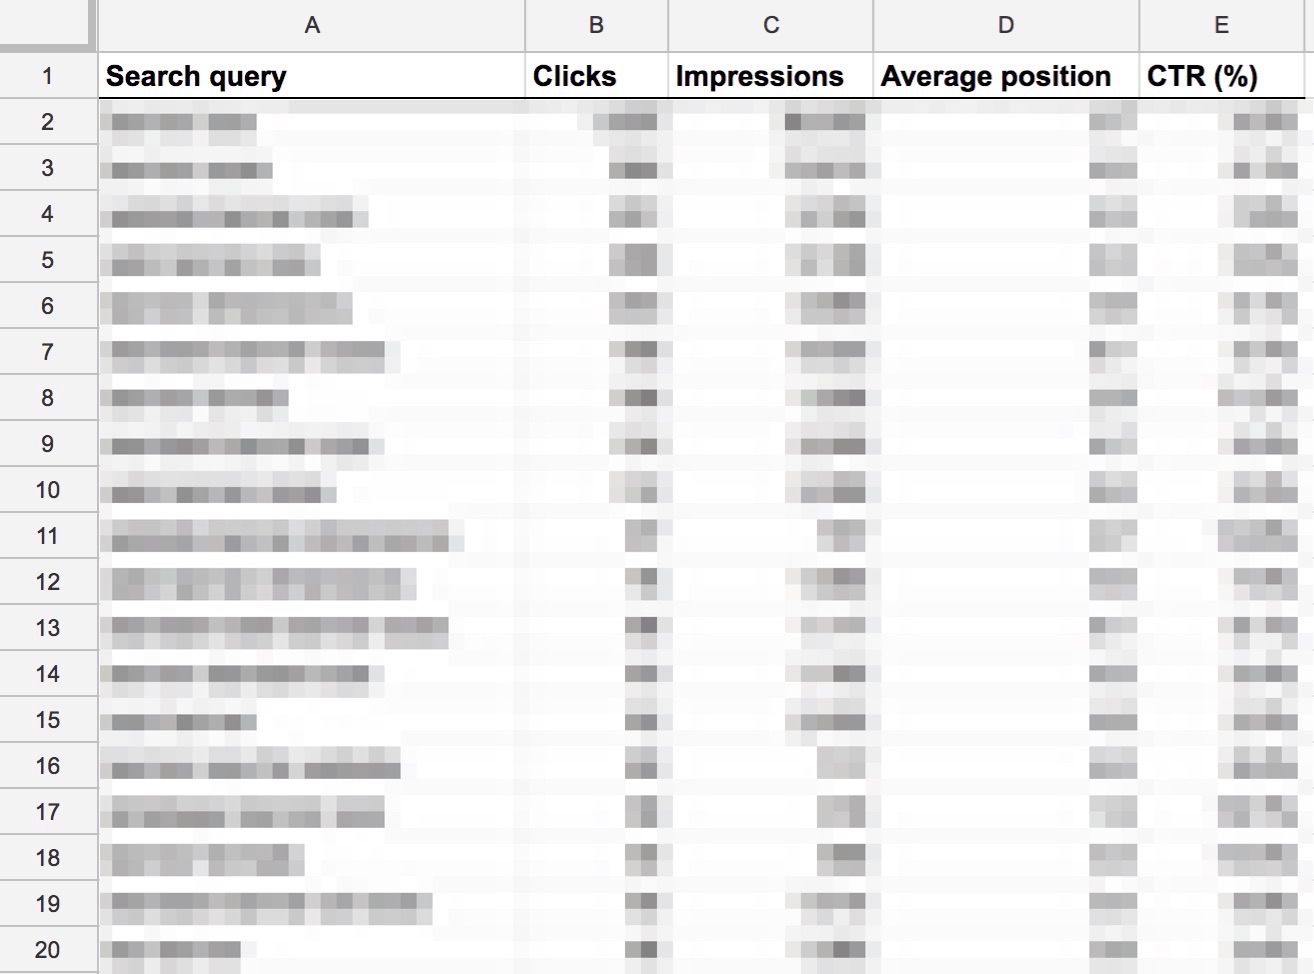
You can also use Supermetrics to setup a simple SEO report through Google Search Console. The report will show you clicks, impressions, average position and CTR for all of your organic Google traffic.
Here are the Supermetrics settings to replicate the SEO report:
- Data source: Google Search Console
- Select sites: select the site you what to create a report for
- Select dates: last X days and type in 90 days (search console currently allows for a maximum reporting period of 90 days)
- In the Supermetrics sidebar under “Options” you can tick “Combine news results with old” to let Supermetrics aggregate periods longer than 90 days
- Select metrics: Clicks, Impressions, Average position, CTR (%)
- Split to rows: Search query
- Sort rows: Clicks
- Sort direction: Descending
- Secondary sort: Automatic
- Filter: Under filter settings you might want to add “Search Type” + “equals” + “WEB”
- Without the filter above your results will also show impressions and clicks from Google image searches
Facebook Ads Performance Report using Supermetrics
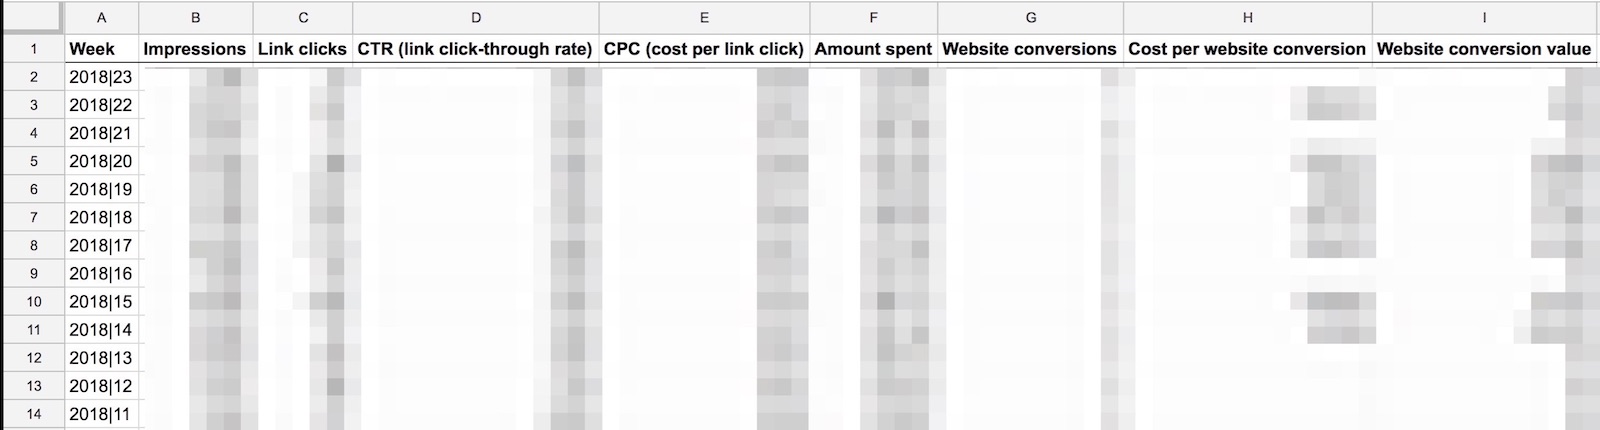
The example above shows a Facebook ads performance report using Supermetrics. It pulls impressions, clicks, CTR, CPC, cost and conversion data from Facebook.
Here are the Supermetrics settings to replicate the Facebook ads report:
- Data source: Facebook Ads
- Select accounts: select the account you what to create a report for
- Select dates: last X weeks and type in 52 weeks (or longer)
- Select metrics: Impressions, Link clicks, CTR (link), CPC (link), Amount spent, Website conversions, Cost per website conversion, Website conversion value
- Split to rows: Year & week (Mon-Sun)
- Sort rows: Year & week (Mon-Sun)
- Sort direction: Descending
- Secondary sort: Automatic
- Filter: You can use the filter option to limit your report to a specific “campaign name”
- Options: Here you can select the conversion window for your reports. The best option is “28 days click” which shows conversions that happened within 28 days after a click. Note that Facebook’s dashboard includes 1-day view-through conversions by default as well. So if you select the “28 d click” option in Supermetrics, there might be a discrepancy between your Facebook dashboard and Supermetrics.
Facebook Page Performance Report using Supermetrics
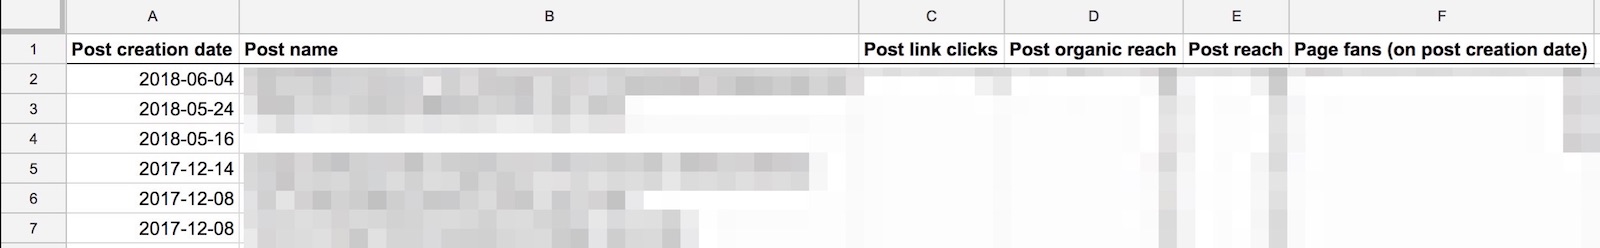
This report is a great example of how you can use Supermetrics for social media reporting. It shows Facebook post performance including link clicks, organic post reach, paid post reach and your reach divided by page likes at the time of publishing.
Here are the Supermetrics settings to replicate the Facebook page performance report:
- Data source: Facebook Insights
- Select pages: select the page you what to create a report for
- Select dates: last X weeks and type in 52 weeks (or longer)
- Select metrics: Impressions, Link clicks, CTR (link), CPC (link), Amount spent, Website conversions, Cost per website conversion, Website conversion value
- Split to rows: Year & week (Mon-Sun)
- Sort rows: Year & week (Mon-Sun)
- Sort direction: Descending
- Secondary sort: Automatic
- Filter: You can use the filter option to limit your report to a specific “campaign name”
- Options: Here you can select the conversion window for your reports. The best option is “28 days click” which shows conversions that happened within 28 days after a click. Note that Facebook’s dashboard includes 1-day view-through conversions by default as well. So if you select the “28 d click” option in Supermetrics, there might be a discrepancy between your Facebook dashboard and Supermetrics.
Bonus: How To Schedule Automatic Refresh For Your Supermetrics Reports
In order to make sure that your reports stay up-to-date, you should setup Supermetrics’ “schedule refresh” feature on all of your Google sheets.
Here’s how to set it up:
Click on Add-Ons -> Supermetrics -> Schedule refresh & emailing
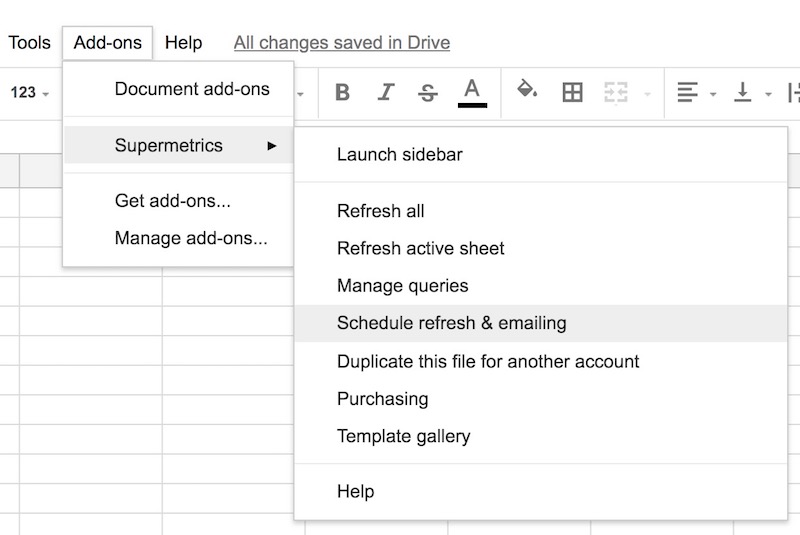
Then setup a trigger and select action “refresh daily” (or “refresh hourly” if you are using Supermetrics super pro).
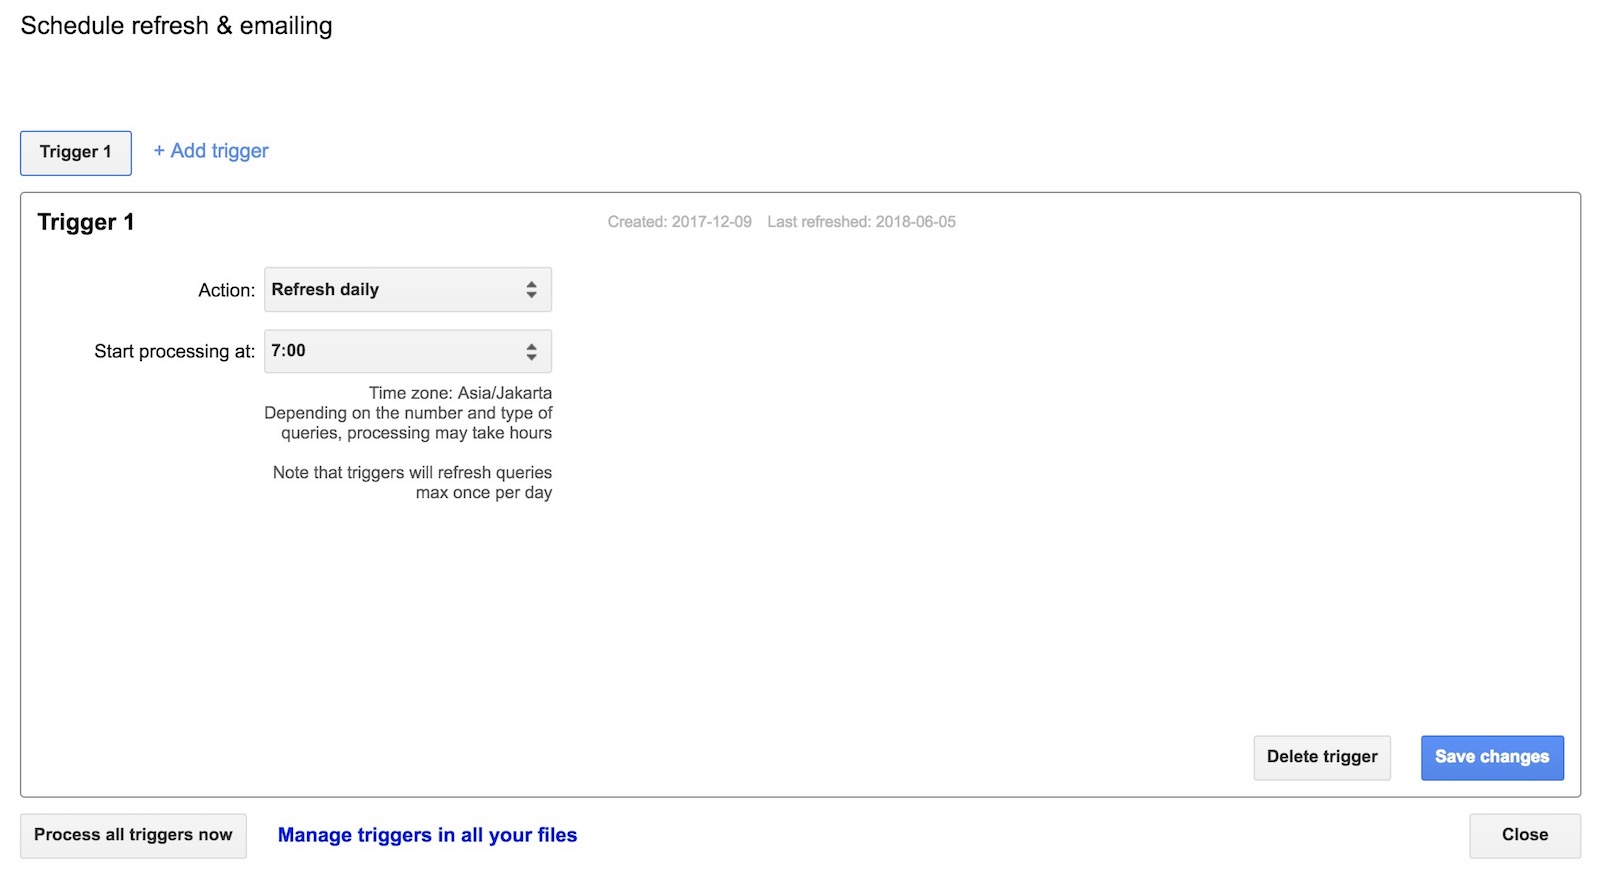
At the end click on “save changes”.
Your report will now start refreshing automatically.
If you haven’t signed up for Supermetrics yet, click here to start your free trial.
Let us know your favorite Supermetrics reports in the comments.
No comments yet.